· Press Release
PTBA Reports Net Profit of IDR 2.93 Trillion in FY2025, Operational Performance Grows and Profitability Gradually Improves
Jakarta, April 1, 2026 – PT Bukit Asam (Persero) Tbk (PTBA) announced its audited consolidated financial results for the year ended December 31, 2025 (FY2025) to the Indonesia Stock Exchange (IDX) and Financial Services Authority (OJK). The Company’s FY2025 consolidated financial statements are accompanied by the independent audit report issued by Purwanto, Sungkoro, and Surja, a member firm of the global Ernst & Young network.
President Director Arsal Ismail stated:
“Amid continued pressure on global coal prices throughout 2025, PT Bukit Asam (Persero) Tbk (PTBA) remained able to maintain solid operational performance. The Company also recorded a sequential improvement in profitability, supported by optimization of its export market portfolio and enhanced cost efficiency. This performance is reflected in the continued growth of both production and sales volumes. In addition, optimal capital expenditure realization has provided a strong foundation to support the sustainability and future growth of the Company’s operational performance.”
Highlights
- PTBA recorded a net profit of IDR 2.93 trillion and EBITDA of IDR 6.08 Trillion, with an EBITDA margin of 14%.
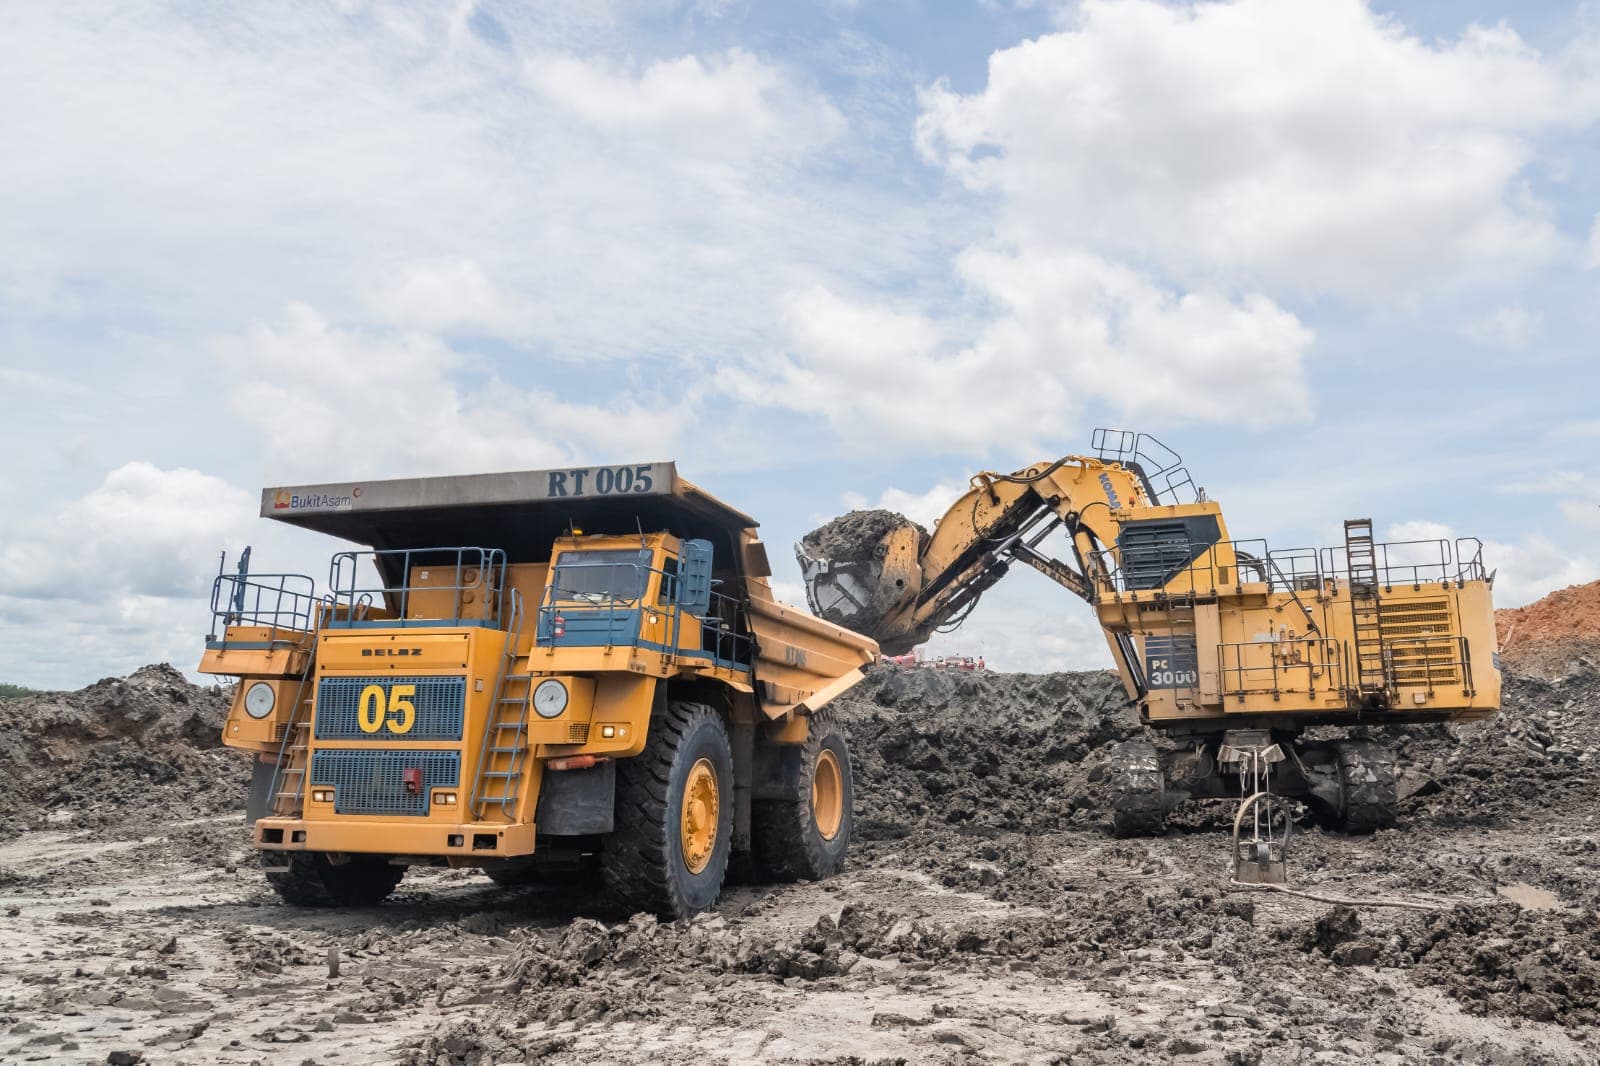
- PTBA delivered solid operational performance, with production increasing by 9% YoY, followed by an 6% YoY increase in sales volume. Despite improved operational performance, the average selling price (ASP) declined by 6%, in line with the continued decline in coal prices, where Newcastle Coal Index (NCI) fell by 22% and ICI-3 decreased by 16% YoY.
- In terms of capital expenditure realization, 63% of the FY2025 target has been achieved, equivalent to IDR 4.55 Trillion.
Operational Performance
(in tons unless otherwise stated for stripping ratio)
|
|
FY25 |
FY24 |
% Changes |
|
Production Volume |
47,188,605 |
43,282,429 |
+9% |
|
Coal Transportation |
40,435,430 |
38,170,293 |
+6% |
|
Sales Volume |
45,428,081 |
42,890,977 |
+6% |
|
Domestic |
24,742,790 |
22,635,452 |
+9% |
|
Export |
20,685,291 |
20,255,525 |
+2% |
|
Stripping Ratio |
6.07 |
6.23 |
- 3% |
Financial Performance
(in million Rupiah unless otherwise stated for earnings per share)
|
Income Statement |
FY25 |
FY24 |
% Changes |
|
Revenue |
42,651,724 |
42,764,968 |
- |
|
Cost of Goods Sold |
36,394,624 |
34,562,758 |
5% |
|
Gross Profit |
6,257,100 |
8,202,210 |
-24% |
|
Operating Profit |
3,208,073 |
5,652,418 |
-43% |
|
Net profit for the year attributable to owners of the parent entity |
2,929,957 |
5,103,720 |
-43% |
|
EBITDA |
6,083,959 |
8,304,264 |
-27% |
|
Earnings per Share (EPS) |
254 |
444 |
-43% |
|
Balance Sheet |
31 Des 25 |
31 Des 24 |
% Changes |
|
Total Assets |
43,917,063 |
41,785,576 |
5% |
|
Total Liabilities |
21,300,262 |
19,141,764 |
11% |
|
Total Equity |
22,616,801 |
22,643,812 |
- |
|
Cash |
4,522,194 |
4,132,858 |
9% |
|
Bank Borrowings |
3,227,525 |
1,397,680 |
131% |
|
Capital Expenditure |
4,551,266 |
2,348,332 |
94% |
FINANCIAL PERFORMANCE ANALYSIS FOR FY2025 CONSOLIDATED STATEMENT OF PROFIT OR LOSS
Revenue and Average Selling Price
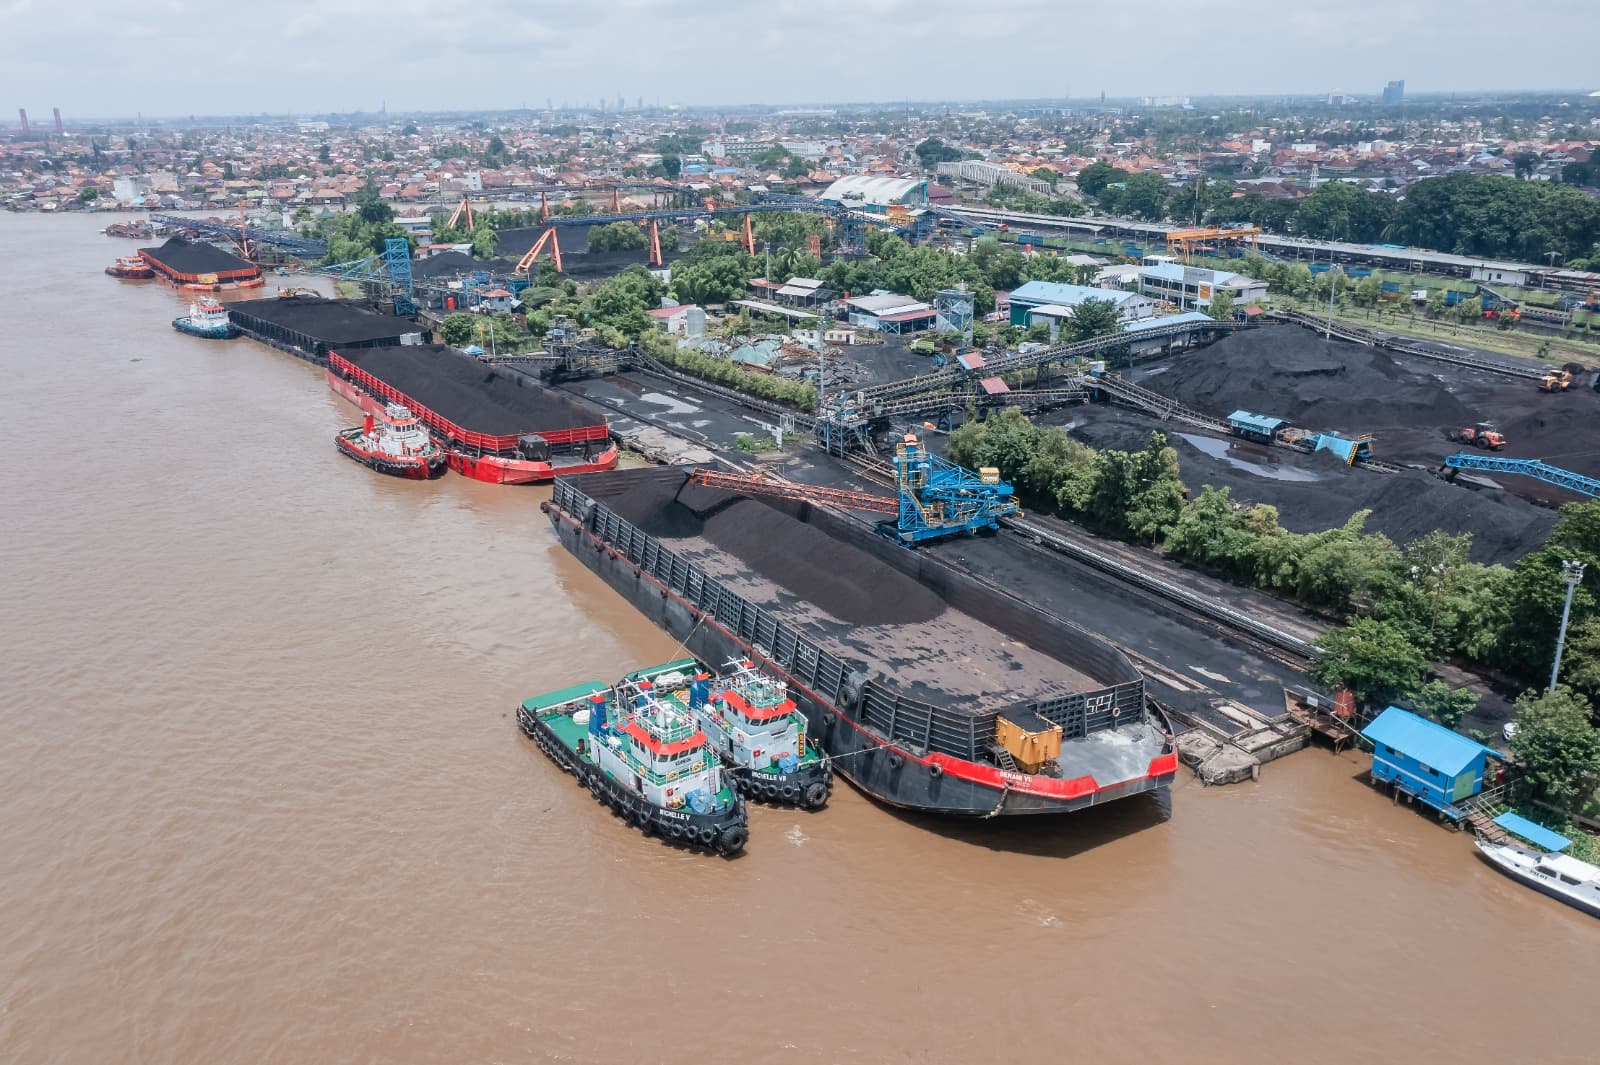
PT Bukit Asam Tbk (PTBA) recorded revenue of IDR 42.65 trillion in FY2025, relatively flat on a year-on-year (YoY) basis. Although sales volume increased by 6% YoY, the decline in coal prices—reflected by a 22% YoY decrease in the Newcastle Index and a 16% YoY decline in ICI-3—resulted in a 6% YoY decrease in average selling price (ASP). As of end-December 2025, domestic sales accounted for 54%, while exports contributed 46% of total sales. The top five export destination countries were Bangladesh, India, Vietnam, South Korea, and the Philippines.
Cost of Goods Sold and Operating Expenses
COGS amounted to IDR 36.39 trillion, representing a 5% YoY increase. This increase was in line with higher operational volumes, with coal production rising by 9% YoY and transportation volume increasing by 6% YoY, despite a lower stripping ratio of 6.07x compared to 6.23x in the same period last year. In addition, the removal of subsidies on the FAME component in biodiesel and the mandatory implementation of B40 led to an increase in fuel prices per liter (+13% YoY), which in turn increased fuel costs for both mining activities and rail transportation.
General and administrative expenses increased by IDR 261.88 billion or 13% YoY, while selling expenses rose by 3% YoY or IDR 23.58 billion, in line with the 6% YoY increase in sales volume.
Finance Income, Finance Costs, and Share in Net Profit of Associates and Joint Ventures
The Company recorded finance income of IDR 219.50 billion, representing a 12% YoY decrease, mainly due to lower interest income from cash placements in banks, time deposits, and bonds. Finance costs amounted to IDR 325.93 billion, up 15% YoY, driven by higher interest expenses from bank borrowings. Meanwhile, the share of net profit from associates and joint ventures reached IDR 671.56 billion, reflecting a 5% YoY increase.
Net profit for the year attributable to owners of the parent entity: Rp2.93 Trillion
CONSOLIDATED STATEMENTS OF FINANCIAL POSITION
Total Assets
Total assets as of December 31, 2025 stood at IDR 43.92 trillion, an increase of 5% compared to IDR 41.79 trillion at the end of 2024. This increase was primarily driven by a 12% rise in non-current assets, equivalent to Rp3.12 trillion, mainly attributable to additions in fixed assets.
Total Liabilities and Equity
Total liabilities increased from IDR 19.14 trillion at the end of December 2024 to IDR 21.30 trillion as of December 31, 2025, mainly due to an increase in bank borrowings. Meanwhile, total equity slightly decreased from IDR 22.64 trillion at the end of December 2024 to IDR 22.62 trillion as of December 31, 2025.
CONSOLIDATED STATEMENTS OF CASH FLOWS
Cash Flows from Operating Activities
Net cash flows generated from operating activities increased from IDR 5.05 trillion to IDR 6.26 trillion, representing a 24% YoY increase. This growth was mainly driven by higher cash receipts from customers and tax refunds.
Cash Flows from Investing Activities
Net cash flows used in investing activities increased from IDR 0.94 trillion to IDR 3.40 trillion as of December 31, 2025. This increase was primarily due to higher additions to fixed assets and productive plantations.
Cash Flows from Financing Activities
Net cash flows used in financing activities decreased from IDR 4.14 trillion to IDR 2.52 trillion. This decrease was in line with dividend payments and reduced bank loan repayments. During the year, the Company distributed dividends amounting to IDR 3.83 trillion.
Capital Expenditures
Capital expenditure as of December 31, 2025 reached IDR 4.55 trillion, primarily allocated to the development of Tanjung Enim-Kramasan coal transportation infrastructure.
PROPOSED FY26 GUIDANCE OF PT BUKIT ASAM (PERSERO) TBK
- Production Volume : 49.55 million tons
- Sales Volume : 49.51 million tons
- Coal Transportation : 41.00 million tons
- Stripping Ratio : 5.63x
- Capital Expenditure : Rp3.64 trillion